HR departments collect an overwhelming amount of data, from employee satisfaction scores to turnover rates. However, traditional reporting methods can make it difficult to quickly identify actionable insights. This is where visual analytics comes in. By using visual tools to display HR metrics, companies can turn complex data into clear, impactful visuals that guide decision-making. This article will explore how visual analytics is transforming HR reporting and how you can leverage it to make data more actionable.
Why Visual Analytics?
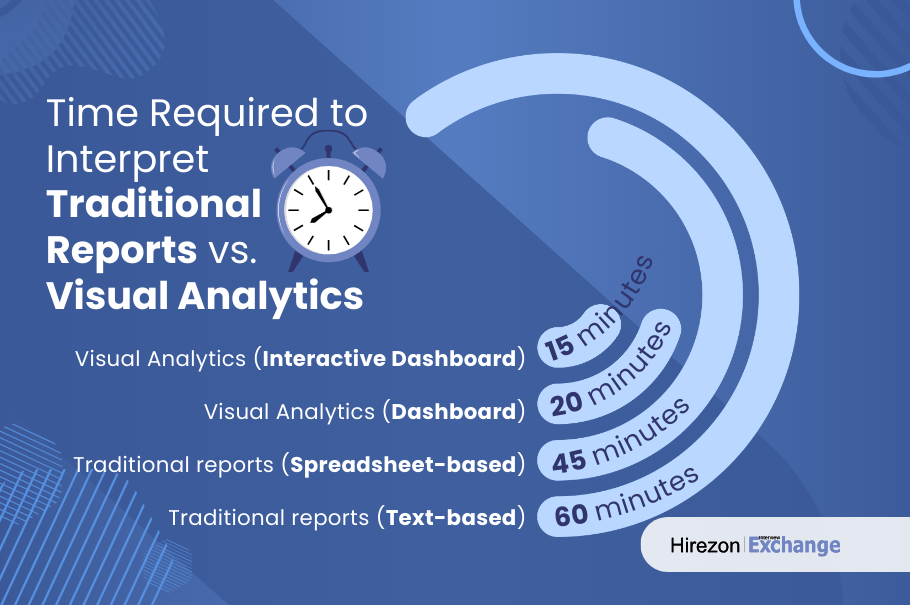
Visual analytics refers to the practice of transforming data into easily understandable visual representations, such as charts, graphs, and dashboards. Research shows that visualizing data can improve data interpretation by 323% compared to traditional data formats, helping leaders make faster, more informed decisions. Visual analytics allows HR professionals to spot patterns, track trends, and understand workforce metrics at a glance, making reporting not only more efficient but more impactful.
Key HR Metrics to Visualize
To make the most of visual analytics, it’s essential to focus on key metrics that impact business outcomes. Here are some crucial HR metrics to visualize:
- Employee Turnover Rate
Purpose: Identify turnover trends and high-risk areas.
Visualization: Line graphs to show monthly turnover rates over time. - Employee Engagement Score
Purpose: Monitor engagement trends and target improvements.
Visualization: Heatmaps for engagement scores by department, showing areas with high and low engagement. - Time-to-Hire
Purpose: Assess the efficiency of recruitment processes.
Visualization: A time-series chart comparing different recruitment channels.
Benefits of Visual Analytics in HR
1. Faster Decision-Making
Visual dashboards allow HR teams to spot issues in real-time. For example, a sudden spike in turnover can immediately prompt a response. According to a study by McKinsey, companies that use data-driven decision-making are 19 times more likely to be profitable than those that do not.
2. Improved Data Accessibility
Non-HR executives can more easily understand HR reports when presented visually, increasing collaboration and buy-in. In a recent survey, 64% of executives noted that visual dashboards improved their understanding of HR metrics.
3. Proactive Talent Management
Visual analytics helps HR teams identify trends and make proactive decisions, such as offering additional support to departments with high burnout risk.
Building an Effective Visual Analytics Strategy
To successfully implement visual analytics in HR, consider the following steps:
- Identify Key Metrics Aligned with Business Goals
Choose metrics that align with business objectives, like retention and productivity. Prioritizing metrics helps focus on areas that drive value. - Select the Right Visualization Tools
Platforms like Tableau, Power BI, and Google Data Studio offer user-friendly interfaces and powerful data processing. - Create Interactive Dashboards
Develop dashboards that are interactive, allowing users to drill down into specific data points. For instance, an HR dashboard can allow users to filter turnover data by department, tenure, or age group. - Regularly Update Dashboards
Ensure data is updated frequently to provide an accurate and current picture. This fosters a culture of data-driven decision-making, as team members have confidence in the information presented.
Case Study: Visual Analytics in Action
Consider a healthcare organization that implemented visual analytics in their HR department. By transforming their reporting into visual dashboards, they reduced the time spent on reporting by 50% and identified high turnover departments more easily. As a result, they could proactively engage employees in those areas, reducing turnover by 15% within the first year.
Transforming HR reporting with visual analytics can revolutionize how companies view and act on data. By visualizing metrics like turnover, engagement, and recruitment efficiency, HR departments can move from reactive to proactive management, impacting both employee satisfaction and organizational success. If your organization hasn’t yet explored visual analytics, now is the time to start.